Introduction
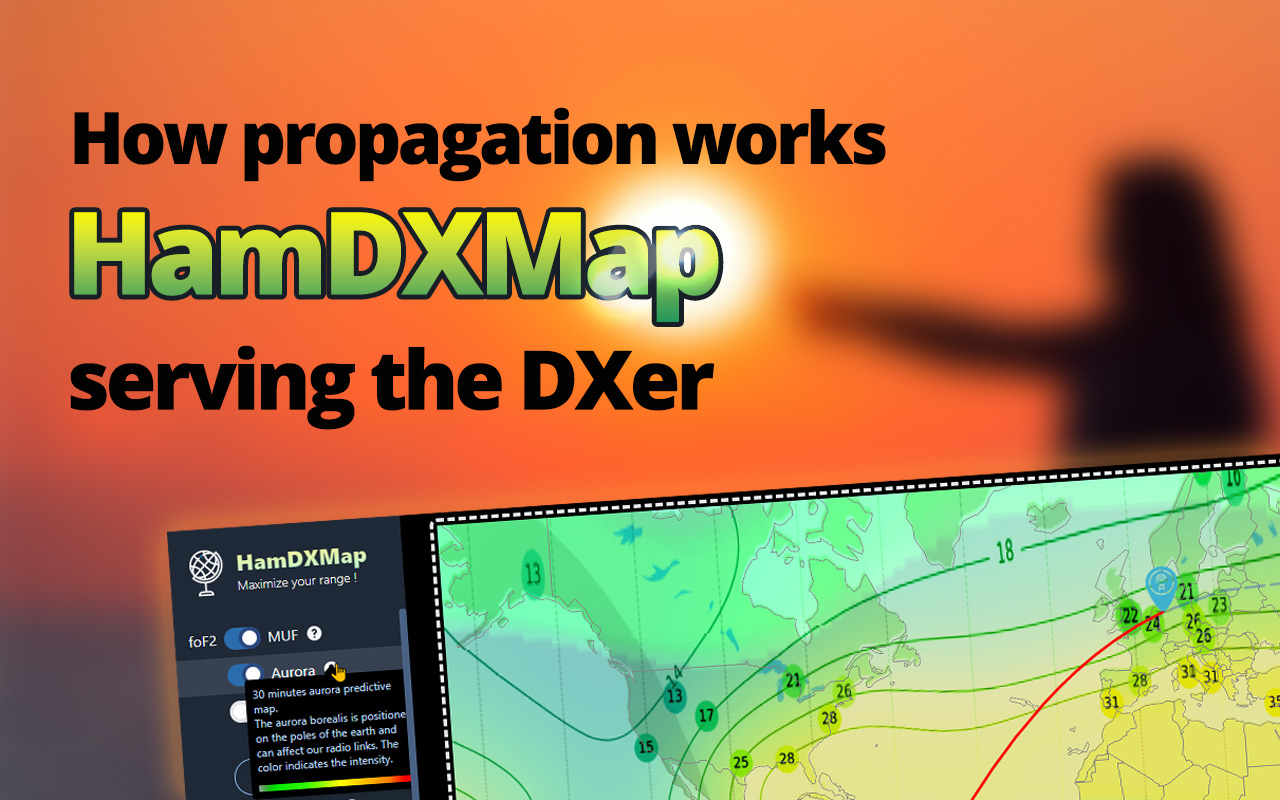
This article introduces you to my latest development, for radio amateurs who like DX and long distance contacts. I have chosen to call this application HamDXMap. The purpose of this article is to present what HamDXMap will bring to long distance contact enthusiasts (DXers) and what I know (and managed to understand) about HF propagation. Presentation of HamDXMap, a real time propagation map.
HamDXMap is a web application, whose interface is in English, to meet the largest number of users. It allows you to represent the world map, in three dimensions or in flat (map), and helps you to know in real time if a link between two stations is possible, or conceivable on a given frequency, and at the moment you check the HamDXMap application. This is made possible by the MUF and foF2 values.
Before describing the HamDXMap application itself, let us first demystify the acronyms MUF and foF2.
What are MUF and foF2?
The MUF (Maximum Usable Frequency) is the maximum frequency that can be used for long distance radio transmission. It is the highest radio frequency that can be used for transmission between two points by bouncing an incident wave off the ionosphere at a specific time and independently of the transmission power.
In radio communications, one of the main methods of long-distance propagation is to reflect (bounce) radio waves off the ionised layers of the atmosphere back towards the Earth diagonally. In this way, radio waves can travel beyond the horizon, around the curvature of the Earth. However, the refractive index of the ionosphere decreases with increasing frequency, so there is an upper limit to the frequency that can be used. Above this frequency, radio waves are not reflected by the ionosphere but are transmitted through it into space.
The ionisation of the atmosphere varies with the time of day and season, as well as solar conditions, so the upper frequency limit for skywave communication varies every hour.
 The acronym foF2 stands for the critical reflection frequency on the F2 layer, i.e. the limit frequency at or below which the wave is reflected by the ionospheric layer and above which it passes through this layer. Below this limit, long-distance contact is not possible.
But then, with a vertical incidence angle (this time), this is the limit frequency at or below which the wave is reflected by the ionospheric layer and below which it passes through this layer. Below this limit, local contacts (NVIS: Near Vertical Incidence Skywave) are therefore facilitated.
For those who are not familiar with the physics of HF wave propagation, I invite you to watch this 20 minutes video made by KO4LZ.
It explains propagation indices, incident angle, ionisation, refraction and reflection layers, MUF and LUF, critical frequency, solar activity…
The MUF and foF2 real time map on HamDXMap
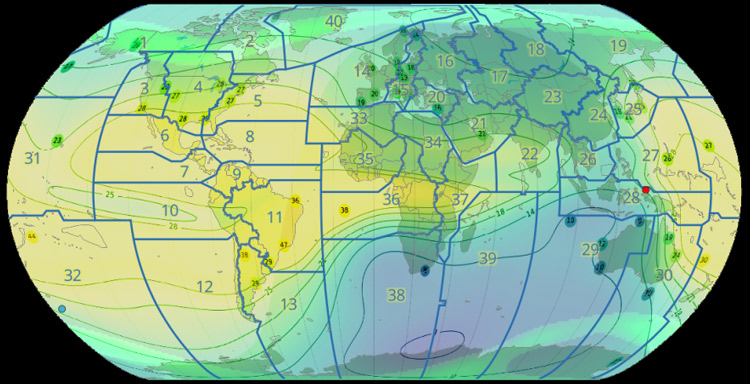
The two integrated maps (MUF and foF2) in HamDXMap are generated and made available by Andrew KC2G who has developed and maintains an amazing ionospheric propagation prediction tool for the HF bands. The result is provided by exploiting the International Reference Ionosphere (IRI) 2020 physical model, with real-time data from GIRO ionosphere sounders and Gaussian interpolation methods.
The probe data are aggregated by the Global Ionosphere Radio Observatory (GIRO) and NOAA.
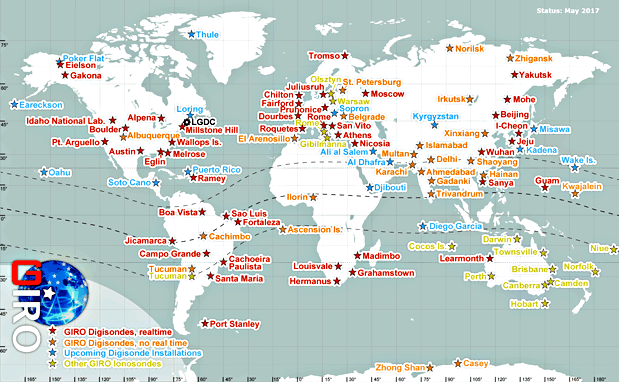
All Operating and upcoming GIRO sites
The maps (MUF and foF2) are updated every 15 minutes, and automatically displayed on HamDXMap (without you having to reload your web page).
Andrew KC2G explains that there are only a limited number of ionosondes in the world making measurements. The majority of the sondes are launched from a few rather dense areas of the world and thus leave large areas remote from probe measurements. This is why the map is generated by interpolation and why, despite the efforts to optimise the algorithm, it can sometimes provide inconsistent or erroneous data in these geographical areas as well.
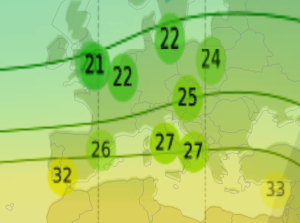
Note that the numbers inside the coloured dots on the MUF and foF2 maps are actually measured data (frequencies in megahertz), and therefore quite reliable.
For those interested in learning more about Andrew’s open source application and development, you can find information in a paper he wrote about his HF propagation prediction tool.
The use of the MUF foF2 HamDXMap propagation application
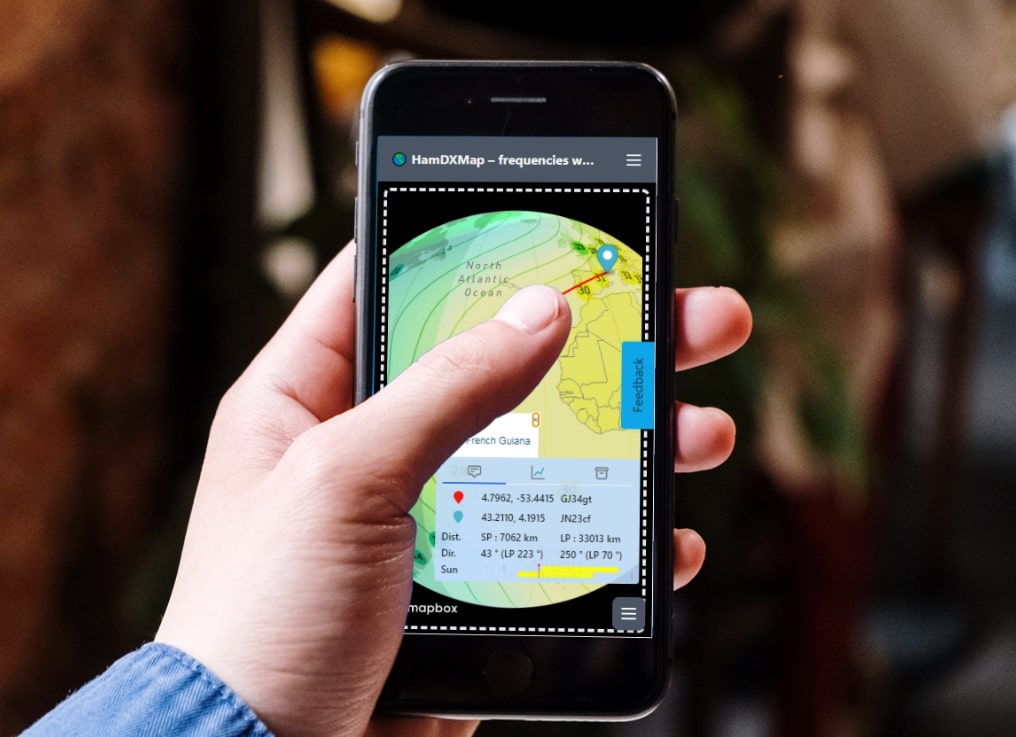 To use the HamDXMap application, you just have to visit with your browser the website https://dxmap.f5uii.net. The application is accessible from a computer but also optimised for mobile devices such as tablets and smartphones (Android, iOS or any other system).
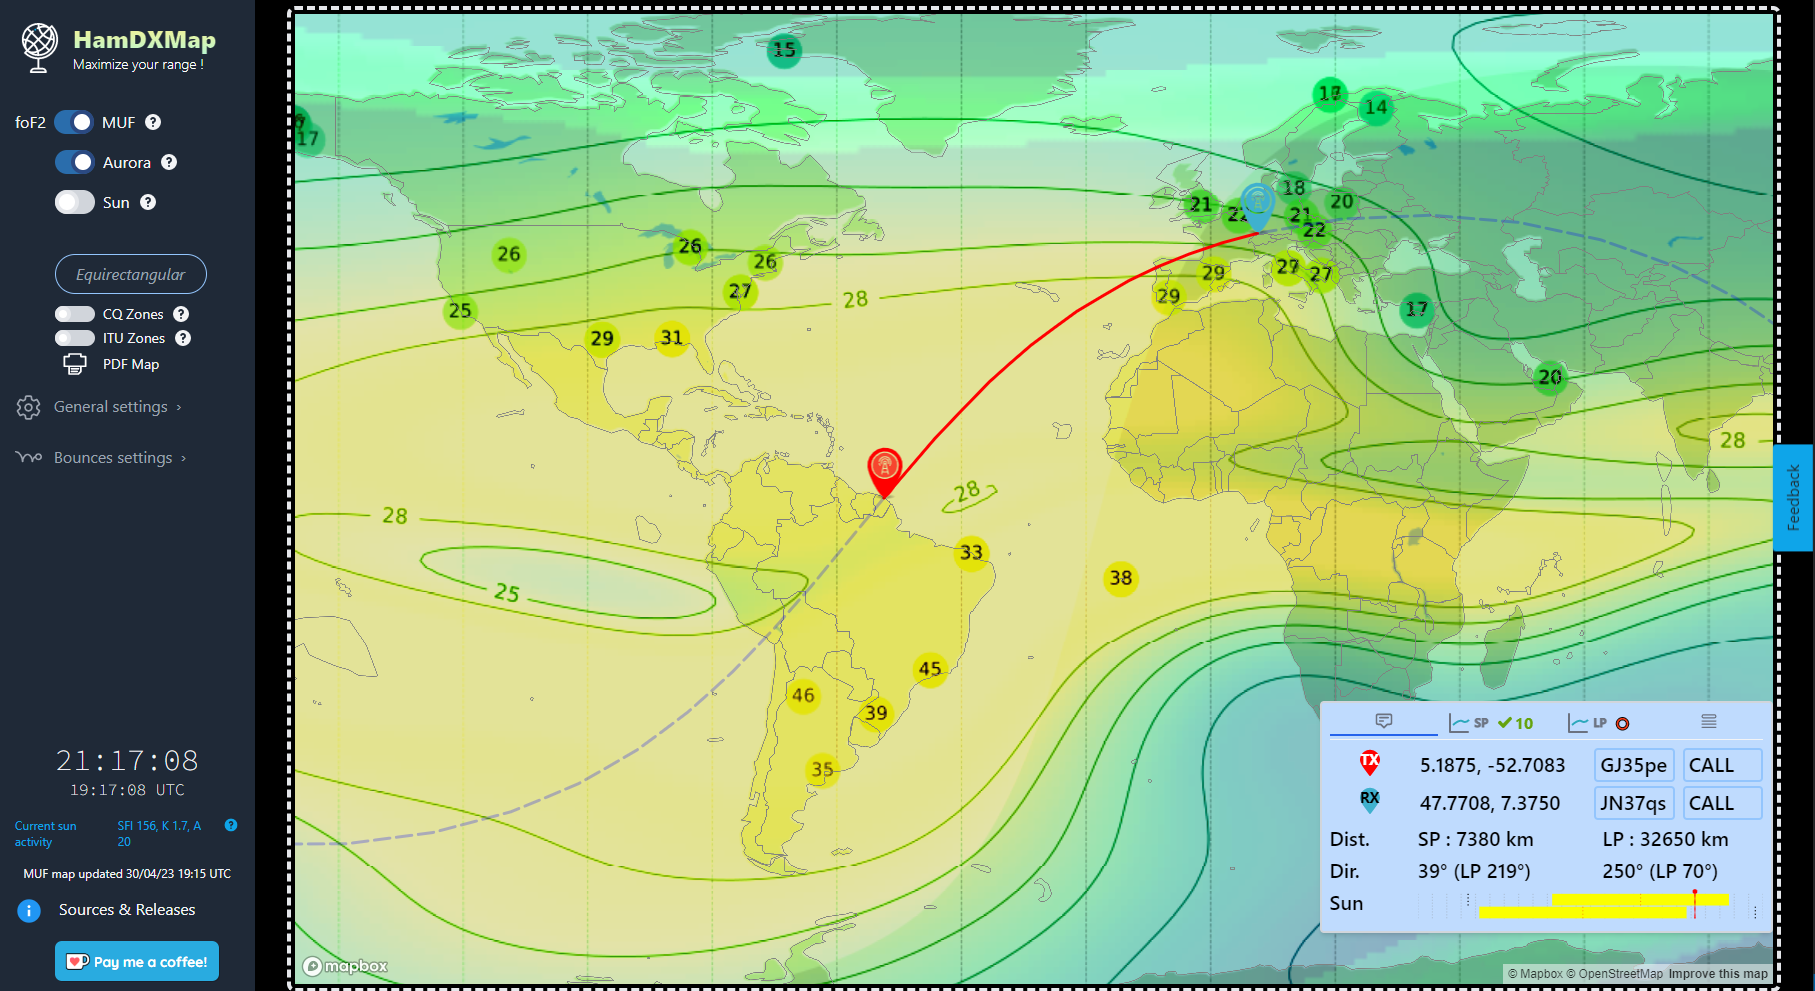
The screen consists of 3 interactive areas:
- The central map with the dots representing the transmitting (red) and receiving (blue) stations
- The main control menu with some settings buttons (on the left, on a folded smartphone by default). When hovering over the question marks, tooltips are displayed giving you information about the hovered feature.
- The information panel at the bottom right offers several tabs.
HamDXMap en plein écran
The main menu of HamDXMap
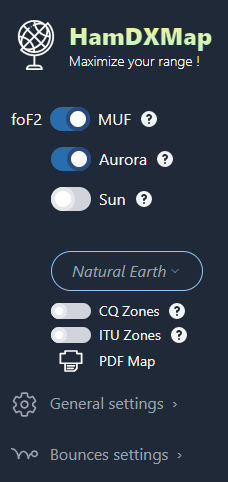
The menu is displayed on the left-hand side of your PC or, from a smartphone, it opens when you press the menu button. Let’s see what the menu offers.
First you find the switch that allows you to display either the MUF map or the foF2 map. By switching the button, you can display either the MUF or the foF2 real time map.
The Aurora button allows you to display the geomagnetic activity around the poles. The aurora borealis, depending on its intensity, will affect the radio links that pass through these regions. The coloured legend gives you information about the relative intensity of the aurora borealis (visible when hovering over the question mark – help).
The Sun button allows you to add or hide a representation of the sun on the map, at the position of the sun (where the sun is vertical to the surface of the globe). By clicking on the sun itself, a representation of the sun in real time is proposed, thanks to the SDO (Solar Dynamics Observatory) source.
With the selector, you can choose between 4 projections and a 3D representation in the style of a globe:
- Mercator (a cylindrical projection) https://en.wikipedia.org/wiki/Mercator_projection
- Equal Earth (a pseudo-cylindrical projection invented in 2018
https://en.wikipedia.org/wiki/Equal_Earth_projection - Equirectangular
- Natural earth projection, proposed in 2012
https://en.wikipedia.org/wiki/Natural_Earth_projection - And the 3D Globe.
About the Aurora Borealis representation
On some occasions, the sun generates large streams of low-energy particles or coronal mass ejections from geomatic storms, which when reaching the earth will focus at the poles and enter the atmosphere. Aurora borealis will then be observed at these latitudes. On the radio side, during these hours of activity, possibly for several days, the absorption D layer will be active and will therefore block the HF waves transiting the poles.
Guide indexes for propagation
At the bottom of the main menu, you have the main indexes that allow you to understand the current HF propagation conditions, the solar flux index (SFI) as well as the K and A indices of terrestrial geomagnetic activities, indicators of the disturbances of the Earth’s magnetic field (K and A).

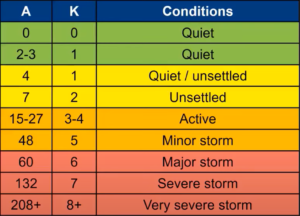
Interpretation of the guiding propagations A and K
CQ and ITU zone maps
The HamDXMap application can display WAZ – CQ and ITU maps. Of course only one is displayed at a time. Use the small switches to choose one or the other, according on your needs.
The settings menu
Since the release N°3, the application offers two sub-menus in the menu, allowing to set up operating parameters.
In the general menu, for the time you can set your callsign, which will allow other functions later, and in the same place you can disable the automatic popup display for callsigns.
Wave bounces
 The settings menu is dedicated to wave bounces. HamDXMap allows to display the wave bounce zones which are determined by user-defined data:
- Altimetry of the ionised layer
- The departure angle of the transmitting antenna
By sliding the adjustment cursors, you will see directly the evolution of the range of your bounce. This is of course a theoretical approach which does not take into account the non-homogeneities of the ionised regions which can lead to dissymmetrical reflections, fading phenomena, among others…
On the map, the bounces are represented by circles whose diameter is determined by the horizontal aperture angle of the antenna, which can help you determine what the directivity angle of your antenna represents in beam width on the map.
Please do not misinterpret this two-dimensional representation: contacts are obviously always possible outside the represented rebound circles!
Navigate HamDXMap
 The interface is somewhat different if you are using a computer, a tablet or a smartphone, but it is still quite standard:
On the map zoom in or out :
- with the wheel of your mouse, or by double clicking on the map
- with the keyboard with + (plus) or = (equal) and – (minus)
- on a smartphone or tablet, by moving two fingers closer to / further away from each other on the map, or double-clicking on the map.
As you move closer to the earth’s surface, the MUF / foF2 layers will fade away to reveal the detailed geography.
The two red and blue markers representing the transmitting and receiving stations are moved directly by drag and drop. The radio path is automatically displayed between the two markers. The red path is the shortest and most direct path between the two points, called the Short Path. In contrast, the dotted path is the longest direct path, called the Long Path. On the path you will see a red dot and a blue dot. These are the points opposite the two markers, the antipodes of the TX and RX stations.
When you click on a country or area that you see lightly circled, you will see the information of the targeted DXCC country.
The real time information area
At the bottom of the screen is the station information and HF conditions panel. Here you will find several tabs.
HamDXMap main radio station information panel
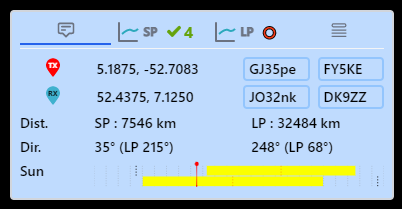
The first tab (Stations tab) is dedicated to geography, with the positioning of the two stations. The transmitting station (logically your station) is the red marker, and the remote station is the blue marker. Let’s see the possibilities offered to move the cursors, basic elements before analysing the propagation “profile” between these two points of the globe:
- As mentioned, you can move the sliders with the mouse (with your finger on smartphones).
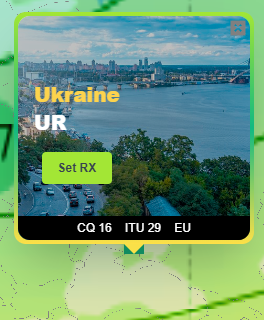
- To place the blue cursor on the map, on a DXCC country, you can click on the map. A popup will open to show you the country (with name of the country, CQ area, ITU). A Set RX button allows you to assign the blue marker to this location (a click in the middle of an ocean in an international zone does not display a popup, it targets a specific DXCC zone)
- In the information panel, next to the Latitude and Longitude positions (decimal values) you will find the square locator (Maidenhead Locator System – Don’t know the town of Maidenhead?) in the form of 6 alphanumeric characters. This field is directly editable by the user. Enter a locator square in one of the fields, and the corresponding marker will be positioned on the map (Tip: No need to do a keyboard entry).
On the first two lines of the first tab you find the positions of the two stations. On the third line you find two distance values that separate the two stations. The first one is the shortest distance which corresponds to the short radio path, which is called SP. On the right hand side, the distance is the longest path, which is called LP.
The fourth line shows the antenna direction between the two stations. The first value is the direction from the TX station (red, you) to the RX station (blue) following the short path (SP).
The Sun bar graph
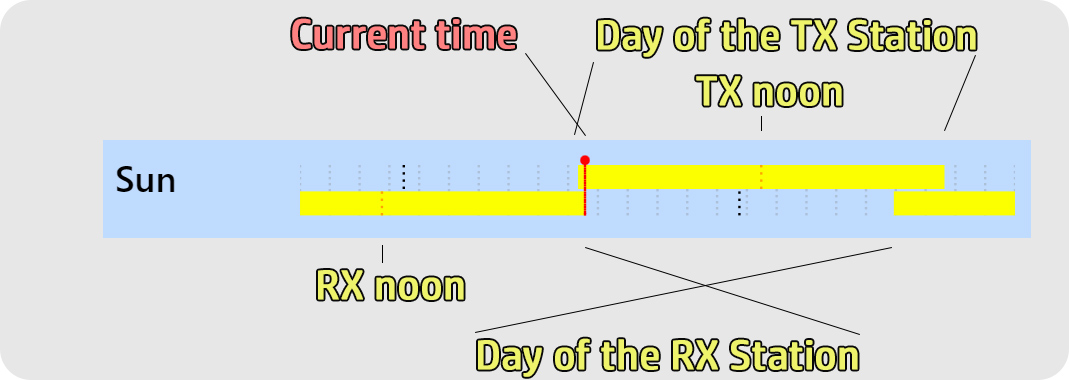
At the bottom of the Stations tab, you have a representation of the sun exposure of both stations. This representation allows you to quickly determine whether the stations are in the night or in the day, in the morning or in the afternoon. As you may know, the day/night transition times are particularly favourable for propagation (greyline). The first line is dedicated to the TX station, the second to the RX station. Let’s see how to read this bargraph of the sun on both stations.
- From left to right, on the x-axis, the 24 UTC hours of the day
- The red line (the needle) represents the present moment
- The yellow rectangles are the illumination of the day. A dotted line in the middle of the rectangle represents the middle of the day of the station.
Entering callsigns directly
You hear a callsign, and you don’t recognise which country it is. HamDXMap can help you to position the heard DX very easily.
HamDXMap makes it very easy to position a station on the map. You just have to enter the callsign of the station in the bottom panel, on the first tab, in one of the two CALL fields. Temporary callsigns are also identified during the time of the activities, thanks to the rules base maintained by AD1C. Jim does a great job of keeping this database up to date and publishes it two to four times a month (Thanks Jim for this great service to the community).
 Positioning accuracy is for some countries based on the rules of ham radio prefix composition. HamDXMap is therefore generally quite accurate in positioning but is even more accurate when the callsign is recognized as a DX-Cluster user. Indeed, DX-Cluster users have the possibility to register their Locator (Maidenhead). I invite you to switch to a cluster and register there (see Set/QTh command).
The MUF and foF2 frequency curves
In the panel you will find two tabs that work in the same way. One is dedicated to the short path (SP) and the other tab is for the long path (LP).
Clicking on these tabs will display a graph showing the evolution of MUF and foF2 along the route between the two radio stations. On the horizontal x-axis you read the distance in kilometers, and on the vertical axis the frequency of MUF and foF2 in megahertz.
We can consider that long-distance contacts are possible over a given frequency range between the maximum frequency of foF2 and the minimum frequency of MUF encountered along the route. I remind you that this is a theoretical limit, and that it is possible in reality that you may encounter cases of feasible contact not presented by the theory proposed by KC2G and HamDXMap.
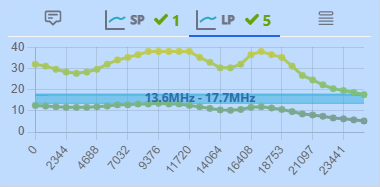
On the SP or LP tab you will find an overview:
The path ✔️ is usable for long distance contact, ⭕️ indicates a poor path, which is not suitable for long distance contact. The number following the tick is the number of megahertz of the possible range for making contact between the two markers, two stations. This allows the user, without having to click on the tab to see the curve, to get an idea at a glance whether a contact seems possible in SP or LP. I remind you that the curves are extracted from the MUF and foF2 maps are extrapolated elements, and that there may be differences between these theoretical elements and the observed reality of propagation.
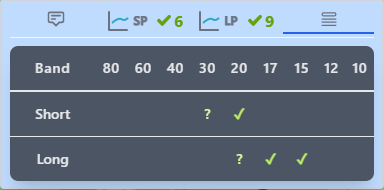
Frequency band activity overview tab
The last tab is the amateur radio bands synthesis tab. HamDXMap proposes a synthesis of the bands that can be used to realize a communication between the two points, in Long Path as well as in Short Path. The question mark symbol is displayed when the theoretical limit is within one megahertz of the amateur band limit.
Print your map
 Whether you want to make a wall map of the CQ areas in your shack or memorise the conditions in which an exceptional contact for you was made, HamDXMap allows you to make two types of PDF printouts:
- The full page map in landscape format
- An information page with all the station positioning information
In the print settings box, you can choose the page format and also remove one or both of the station positioning markers.
Concluding remarks
The purpose of this article was to make a collection and guide of the numerous functionalities proposed to date, of HamDXMAP, the functionalities will c The features will soon evolve and be enriched, as well as to explain some notions of propagations
More features to come?
Yes, there is no lack of ideas… (the time available to develop them, however…)
- The feature of displaying directly on HamDXMap the contacts typed (or being typed) in a log book. This allows to locate directly the remote station on the map without having to re-enter the callsign in addition to the log software. The choice was made to carry out the development with Win-Test, a very complete software. A gateway is under development and will ensure the real time transmission from Win-Test to HamDXMap. The first tests are promising as you can see on my Twitter post. For developers, the input interface is JSON communicating in WebSocket. An API documentation will be published so that other software can be interfaced.
- Based on a proposal by José CT1BOH, HamDXMap could record the MUF and foF2 areas occupied by the different frequency bands. This would provide an indicator of the state of propagation, compared to historical data…
How can I contribute to the project?
If you find the project interesting and would like to help out, please spread the word about HamDXMap.
- You are invited to publish a link to HamDXMap on your QRZ.com page or your personal or radio club website. For this, I have prepared a page of source code for you to copy and paste: Logo and HTML link guide
- You are invited to propose ideas to improve or enhance the features of HamDXMap on this Feedback platform. If you detect a bug, this is also where you can report it.
- You can also contribute to the hosting costs of the site by offering me a coffee from time to time, or monthly for that matter. On this platform are published the updates and news of HamDXMap. You will be automatically informed of the evolutions as a follower: https://ko-fi.com/f5uii
Acknowledgements
This is another opportunity to thank Andrew KC2G for his wonderful development of the MUF foF2 cards. His project is a wonderful piece of work that he continues to improve. Thank you Andrew.
I also thank the different sources that contribute HamDXMap:
- Jim AD1C for the DXCC country prefix database
- Laurent F6FVY for regular updates of callsigns and their locators
- NOAA National Oceanic and Atmospheric Administration for aurora borealis forecasts, solar and geomagnetic flux indexes
- For dynamic illustrations of countries, Pixabay
- Also, for communication media, the resources of Pexels.
I wish you a good discovery, a good everyday practice of 🌎HamDXMap !
![]()
bonjour
je vous remercie pour votre site sur l’affichage de la MUF. J’ai tout lu !! Simplement je n’arrive pas à passer à la pratique. Je suis preneur d’un ou 2 exemples très opérationnels pour fidéliser l’utilisation de votre site.
bien cordialement
73, F5HMG
(Translation)
Hello
I would like to thank you for your site on the MUF display. I have read everything! I just can’t seem to put it into practice. I’m interested in one or 2 examples very operational to make the use of your site more faithful.
Sincerely 73 F5HMG
Bonjour Yves,
Merci de l’intérêt porté à HamDXMap. Une vidéo explicative est proposée en allemand et une autre en français sur YT (HamDXMap 🌍 Live foF2 & MUF Weltkarte ou HamDXMap de F5UII – Christian) . Sinon, une conférence au sujet de MUF et HamDXMap aura lieu au salon HamExpo 2023.
73
(Translation)
Hello Yves,
Thank you for your interest in HamDXMap. An explanatory video is available in German and another in french on YT ( (HamDXMap 🌍 Live foF2 & MUF Weltkarte or HamDXMap de F5UII – Christian) . Otherwise, a conference about MUF and HamDXMap will be organised at salon HamExpo 2023.
73
Bravo Christian pour cette super application et super présentation hier (au salon HamExpo 2023 Le Mans, NDLR)
on te fera du retour et de la pub.
Michel
F5FLN
(Translation)
Bravo Christian for this great application and great presentation yesterday (at HamExpo 2023 Le Mans, editor’s note).
we’ll be in touch and give you some publicity.
Michel
F5FLN
Merci Michel pour avoir fait partie du public venu nombreux à ma conférence.
Bons DX avec HamDXMap 😉, 73
(Translation)
Thank you Michel for being part of the large audience at my conference.
Good DX with HamDXMap 😉, 73
Great application and Ham Radio resource Christian, thank you so much.
Do you run your own .kc2g server instance or do you obtain the MUF data directly from Andrew’s site via an API?
(Traduction)
Excellente application et ressource pour les radioamateurs, Christian, merci beaucoup.
Utilisez-vous votre propre instance de serveur .kc2g ou obtenez-vous les données MUF directement du site d’Andrew via une API ?
Thanks Hilary. The map analysis work is done on my server using the images published by KC2G.
(Traduction)
Merci Hilary. Le travail d’analyse de la carte est fait ma mon serveur à partir des images publiées par KC2G.
Thanks Christian,
So are you running your own server instance from the code on Github?
https://github.com/arodland/prop
I would love to be able to take the MUF data and display on my own site using Leaflet.
Can you give me any advice about how to do this?
(Traduction)
Merci Christian,
Vous utilisez donc votre propre instance de serveur à partir du code sur Github ?
https://github.com/arodland/prop
J’aimerais pouvoir prendre les données MUF et les afficher sur mon propre site en utilisant Leaflet.
Pouvez-vous me donner des conseils sur la façon de le faire ?
Not at all. My server regularly downloads the images produced by Andrew’s server. Image conversion processing is carried out to make it compatible with the desired display and to extract data from the grey layer of the image (MUF curve for a given path).
Larry F6FVY has done this with Leaflet http://f6fvy.free.fr/muf/
(Traduction)
Non pas du tout. Mon serveur télécharge régulièrement les images produites par le serveur de Andrew. Un traitement de conversion d’image est réalisé pour le rendre compatible de l’affichage souhaité et permettant l’extraction des données de la couche grise de l’image (courbe de MUF pour un trajet donnée).
Laurent F6FVY a en effet réalisé cela avec Leaflet http://f6fvy.free.fr/muf/
Ahh OK,
I see you are cropping and slicing the image server side and then using Mapbox to load them.
Larry F6FVY looks like he is loading the whole image without cropping into Leaflet.
Are you using the GD Library for PHP or something else to crop and slice the image?
For Leaflet, I would probably need to crop the image removing the left and bottom scales and colour legend.
Would you have any server side code you could share to get me started?
(Traduction)
Ahh OK,
Je vois que vous recadrez et découpez l’image côté serveur et que vous utilisez Mapbox pour la charger.
Larry F6FVY semble charger l’image entière sans recadrage dans Leaflet.
Utilisez-vous la bibliothèque GD pour PHP ou autre chose pour recadrer et découper l’image ?
Pour Leaflet, je devrais probablement recadrer l’image en supprimant les échelles de gauche et du bas et la légende des couleurs.
Auriez-vous un code côté serveur que vous pourriez partager pour me permettre de commencer ?
The SVG is processed to reduce it to the bare essentials and then processed with Inkscape.
I won’t share any of my development code, as it’s very specific and takes a lot of time to explain. I don’t have the time to do that. What’s more, behaviour often depends on the versions of software and systems on which it runs.
(Traduction)
Il y a un traitement du SVG pour épurer au stricte nécessaire puis des traitements avec Inkscape.
Je ne partagerais pas de code de mon développement, comprenez que c’est un code très spécifique, qui consomme beaucoup de temps à expliciter. Je n’ai pas de temps disponible à cela. De plus, souvent les comportement sont fonction des versions de logiciels et systèmes sur lequel il tourne.